Despite almost daily reports of a housing market crash since September 2022, the data shows that the British (and Warrington) property market is doing OK.
So, let’s dive into the stats and start with the life blood of the housing market – new properties coming on to the market.
𝗡𝗮𝘁𝗶𝗼𝗻𝗮𝗹𝗹𝘆, 𝟰𝟰𝟰,𝟲𝟲𝟴 𝗨𝗞 𝗽𝗿𝗼𝗽𝗲𝗿𝘁𝗶𝗲𝘀 𝗰𝗮𝗺𝗲 𝗼𝗻 𝘁𝗼 𝘁𝗵𝗲 𝗺𝗮𝗿𝗸𝗲𝘁 𝗶𝗻 𝗤𝟭 𝟮𝟬𝟮𝟰.
(𝗤𝟭 = 𝗝𝗮𝗻 & 𝗙𝗲𝗯 & 𝗠𝗮𝗿𝗰𝗵)
Interesting when compared to 407,946 UK properties in Q1 2023 and the 7-year Q1 average (2017 to 2023) of 403,105 new properties on the market.
New properties coming onto the market are a vital bellwether of the property market.
Why? Well in 2008, the number of properties coming on the market in Q1 was double that of 2007, this meant supply (number of homes on the market) vastly outstripped demand and hence economics dictated, and house prices fell.
𝗧𝗵𝗲 𝗯𝗮𝗹𝗮𝗻𝗰𝗲 𝗼𝗳 𝗵𝗼𝘂𝘀𝗲𝘀 𝗰𝗼𝗺𝗶𝗻𝗴 𝗼𝗻 t𝗵𝗲 𝗺𝗮𝗿𝗸𝗲𝘁 𝗮𝗻𝗱 𝗵𝗼𝘄 𝗺𝗮𝗻𝘆 𝘀𝗲𝗹𝗹 𝗱𝗲𝘁𝗲𝗿𝗺𝗶𝗻𝗲 𝘄𝗵𝗮𝘁 𝗵𝗮𝗽𝗽𝗲𝗻𝘀 𝘁𝗼 𝗽𝗿𝗼𝗽𝗲𝗿𝘁𝘆 𝗽𝗿𝗶𝗰𝗲𝘀.
So how do you know if we are heading for another Warrington house price crash as we did in 2008 or not, as the case maybe?
Let me share a quick and easy way to find out before anyone else.
Initially, perform a Rightmove search in Warrington and write down the number of properties for sale every week. Next, carry out the same search, yet this time include sold subject to contract properties and make a note of that. The difference between the two numbers will show the number properties sold subject to contract. The final step is to calculate the ratio between the first two numbers: i.e., what’s available versus what’s been sold.
If the ratio of sold property to available property rises monthly, the market is improving. If the ratio is falling, the market is slowing.
If you really wish to go deep into this; you could split the search into property type (and bedrooms) you are selling and buying e.g., detached, semi, terraced/town house or apartments. This will help you to judge demand and supply and time the market to your advantage.
𝗡𝗲𝘅𝘁, 𝗹𝗼𝗼𝗸𝗶𝗻𝗴 𝗮𝘁 𝗵𝗼𝘂𝘀𝗲 𝘀𝗮𝗹𝗲𝘀 𝗻𝗮𝘁𝗶𝗼𝗻𝗮𝗹𝗹𝘆,𝟯𝟬𝟮,𝟯𝟴𝟮 𝗽𝗿𝗼𝗽𝗲𝗿𝘁𝗶𝗲𝘀 𝘀𝗼𝗹𝗱 (𝘀𝘁𝗰) 𝗶𝗻 𝗤𝟭 𝟮𝟬𝟮𝟰.
However, the devil is in the data. Comparing with previous stats, in Q1 2023, 276,482 properties sold stc whilst the 8-year Q1 average (2017 to 2024 inclusive) was 304,363.
Obviously, the medium term 8-year UK average includes Q1 2021, where 397,402 properties had sold stc and Q1 2022 when 341,888 properties sold stc. Both of those years were exceptional; however, when we compare Q1 2024 to the Q1 average of 2017/18/19/20, a more reasonable 282,488 houses were sold stc on average.
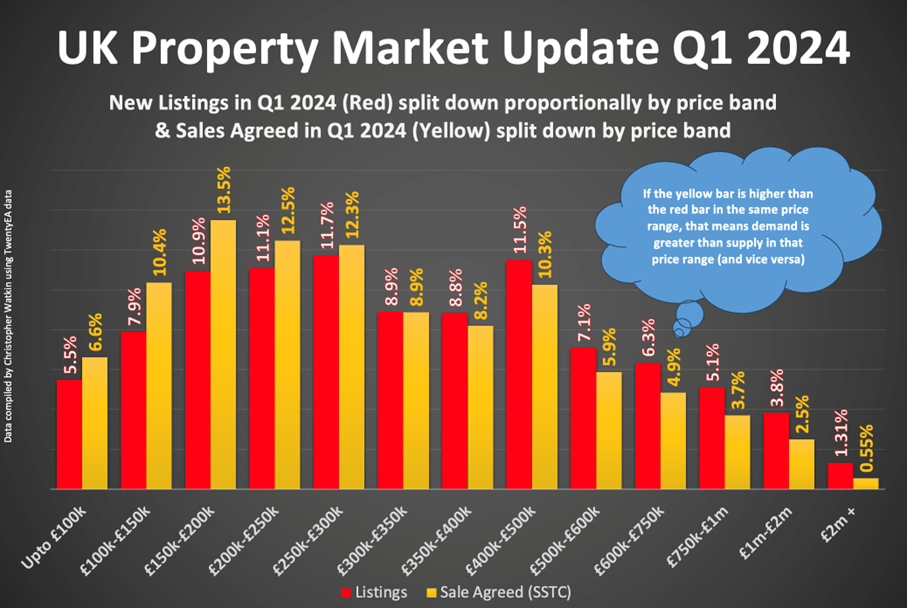
Next, I wish to look at what is selling nationally by price band.
- 35.4% of the properties that came on the market in Q1 2024 were up in the price band up to £250k, yet 42.9% of the home sales (SSTC) were in this band.
- 41.0% of the properties that came on the market in Q1 2024 were in the £250k to £500k price band, yet only 39.6% of the home sales (SSTC) were in this band.
- 13.4% of the properties that came on the market in Q1 2024 were in the £500k to £750k price band, yet only 10.7% of the home sales (SSTC) were in this band.
- 5.1% of the properties that came on the market in Q1 2024 were in the £750k to £1m price band, yet only 3.7% of the home sales (SSTC) were in this band.
- 5.1% of the properties that came on the market in Q1 2024 were in the £1m + price band, yet only 3.1% of the home sales (SSTC) were in this band.
Looking locally at the Q1 stats, starting with the number of properties in the Warrington area (WA1 to WA5) that came onto the market in Q1 2024 …
𝟭,𝟯𝟵𝟱 𝗽𝗿𝗼𝗽𝗲𝗿𝘁𝗶𝗲𝘀 𝗰𝗮𝗺𝗲 𝗼𝗻𝘁𝗼 𝘁𝗵𝗲 𝗺𝗮𝗿𝗸𝗲𝘁 𝗶𝗻 𝗤𝟭 𝟮𝟬𝟮𝟰𝗶𝗻 𝘁𝗵𝗲 𝗪𝗮𝗿𝗿𝗶𝗻𝗴𝘁𝗼𝗻 𝗮𝗿𝗲𝗮.
The average price of those Warrington properties coming to the market was £311,177.
The price range/band that saw the most listings was the £200k to £250k range, where 228 Warrington area properties came onto market (closely followed by the £250k to £300k range, where 220 properties came onto the market).
Now, looking at sales in Warrington …
𝟭,𝟬𝟮𝟰 𝗽𝗿𝗼𝗽𝗲𝗿𝘁𝗶𝗲𝘀 𝘄𝗲𝗿𝗲 𝘀𝗼𝗹𝗱 𝗶𝗻 𝗤𝟭 𝟮𝟬𝟮𝟰 𝗶𝗻 𝘁𝗵𝗲 𝗪𝗮𝗿𝗿𝗶𝗻𝗴𝘁𝗼𝗻 𝗮𝗿𝗲𝗮.
The average price of those Warrington properties selling was £266,101.
The price range/band that saw the most sales was the £150k to £200k range, where 189 Warrington area properties were sold (again closely followed by the £200k to £250k range with 182 Warrington area properties sold subject to contract).
𝗧𝘆𝗽𝗶𝗰𝗮𝗹 𝗳𝗶𝗿𝘀𝘁–𝘁𝗶𝗺𝗲 𝗯𝘂𝘆𝗲𝗿 𝗽𝗿𝗼𝗽𝗲𝗿𝘁𝗶𝗲𝘀 𝗮𝗿𝗲 𝗹𝗲𝗮𝗱𝗶𝗻𝗴 𝘁𝗵𝗲 𝗿𝗲𝗰𝗼𝘃𝗲𝗿𝘆.
Although economic turbulence remains, the UK property market is gradually moving towards pre-pandemic activity levels.
Some of you might have noticed with the national listings and sales figures mentioned above, that the lower priced range of properties are performing better than the higher priced properties. For example, just over a third (35.4%) of UK listings were £250k or below, yet that price band accounted for over 1 in 2.3 house sales (42.9%). Meanwhile, at the other end of the scale, 8.9% of listings in the UK in Q1 ’24 were in the £750k to £2m price band, yet only 6.2% of the sales were in the same band. In the £2m+ price range, even though the numbers are very small, the difference is quite startling, 1.3% of listings were £2m+, but only 0.55% of sales agreed were in the same range.
So, what does this all mean for Warrington homeowners wanting to sell in this market?
Realistic pricing when you put your house on the market is everything!
𝗜𝗻 𝗤𝟭 𝟮𝟬𝟮𝟰, 𝘁𝗵𝗲𝗿𝗲 𝗵𝗮𝘃𝗲 𝗯𝗲𝗲𝗻𝟭𝟵𝟴,𝟲𝟴𝟮 𝗽𝗿𝗶𝗰𝗲 𝗿𝗲𝗱𝘂𝗰𝘁𝗶𝗼𝗻𝘀 𝗼𝗻 𝘁𝗵𝗲 𝟲𝟯𝟯,𝟰𝟭𝟳𝗽𝗿𝗼𝗽𝗲𝗿𝘁𝗶𝗲𝘀 𝗼𝗻 𝘁𝗵𝗲 𝗺𝗮𝗿𝗸𝗲𝘁.
In comparison, there were 243,602 price reductions in Q1 2023 on the 590,481 properties on the market and 119,068 price reductions in Q1 2022 on 424,796 properties on the market.
It is better to come on the market at a realistic price to start when the property is fresh to the market, than go on at a high price, lose that initial honeymoon period and then reduce it, only for some people to wonder what was wrong with the property.
Although higher mortgage rates and economic headwinds present challenges, many potential Warrington home buyers who were effectively side-lined in the fierce bidding wars of 2021/22 will find that a slower paced Warrington property market gives them time to plan a strategy for their next move as we go into the traditionally busy post-Easter house buying season.
𝗪𝗵𝗶𝗹𝗲 𝘁𝗵𝗲 𝗱𝗲𝗺𝗮𝗻𝗱 𝗳𝗼𝗿 𝗾𝘂𝗮𝗹𝗶𝘁𝘆 𝗪𝗮𝗿𝗿𝗶𝗻𝗴𝘁𝗼𝗻 𝗵𝗼𝘂𝘀𝗲𝘀 𝗶𝘀 𝘀𝘁𝗶𝗹𝗹 𝗵𝗲𝗮𝗹𝘁𝗵𝘆, 𝗶𝗳 𝘁𝗵𝗲 𝗮𝘀𝗸𝗶𝗻𝗴 𝗽𝗿𝗶𝗰𝗲 𝗶𝘀 𝗮𝗯𝗼𝘃𝗲 𝘁𝗵𝗲 𝗰𝘂𝗿𝗿𝗲𝗻𝘁 𝗺𝗮𝗿𝗸𝗲𝘁, 𝘀𝗲𝗹𝗹𝗲𝗿𝘀 𝗺𝗮𝘆 𝗻𝗲𝗲𝗱 𝗵𝗲𝗹𝗽 f𝗶𝗻𝗱𝗶𝗻𝗴 𝗯𝘂𝘆𝗲𝗿𝘀.
Determining a realistic price is crucial but not easy. Many sellers look at similar properties on property portals, but those prices may be over-inflated.
Estate agents have more tools at their disposal, such as comparing sale prices for comparable properties, £/sqft and thinking about prospective purchasers in the market for the type of property under valuation.
Although getting the price right can be difficult, revising it downwards quickly is essential.
Warrington homeowners should ensure that their property looks better value for money than similar properties. If you plan to trade up, it is good sense to sell at realistic prices, as you will gain substantial savings compared to moving in the last few years.
However, if you don’t need to sell urgently, becoming a landlord could be an option – again I can help on that if needs be. Nevertheless, Warrington homeowners-turned-landlords should consider that if property values do drift downwards in the coming 12/18 months, it may take a few more years after that to recover to those values seen last year.
𝗪𝗵𝗮𝘁𝗲𝘃𝗲𝗿 𝘁𝗵𝗲 𝗿𝗲𝘀𝘁 𝗼𝗳 𝟮𝟬𝟮𝟰 𝗯𝗿𝗶𝗻𝗴𝘀, 𝗺𝗼𝘃𝗶𝗻𝗴 𝗵𝗼𝗺𝗲 𝘀𝗵𝗼𝘂𝗹𝗱 𝗺𝗼𝘀𝘁𝗹𝘆 𝗯𝗲 𝗯𝗮𝘀𝗲𝗱 𝗼𝗻 𝘆𝗼𝘂𝗿 c𝗶𝗿𝗰𝘂𝗺𝘀𝘁𝗮𝗻𝗰𝗲𝘀 𝗮𝗻𝗱 𝗻𝗼𝘁 𝘀𝗼𝗹𝗲𝗹𝘆 𝗼𝗻 𝘄𝗵𝗮𝘁 𝗶𝘀 𝗵𝗮𝗽𝗽𝗲𝗻𝗶𝗻𝗴 𝘁𝗼 𝗪𝗮𝗿𝗿𝗶𝗻𝗴𝘁𝗼𝗻 𝗽𝗿𝗼𝗽𝗲𝗿𝘁𝘆 p𝗿𝗶𝗰𝗲𝘀.
𝗪𝗮𝗿𝗿𝗶𝗻𝗴𝘁𝗼𝗻 𝗤𝟭 𝟮𝟬𝟮𝟰 𝗣𝗿𝗼𝗽𝗲𝗿𝘁𝘆 𝗠𝗮𝗿𝗸𝗲𝘁 𝗥𝗲𝗽𝗼𝗿𝘁 – Warrington (belvoir.co.uk)